

Does discrimination cause poor mental health in sexual minorities?
A literature takedown

Achives of Sexual Behavior had an issue on poor mental health in sexual minorities (gays) and gender minorities (transsexuals). Michael Bailey wrote a commentary where he proposed a genetic model as an alternative to the minority stress model which seems to be mainstream. In the minority stress model, when you are gay/transsexual AND you live a society where you experience stigma and discrimination, this makes you more stressed than others and this makes you have poorer mental health. So 1) minority status causally makes you worse off, but only if 2) you happen to live in a society where people don’t like you. Graphically:
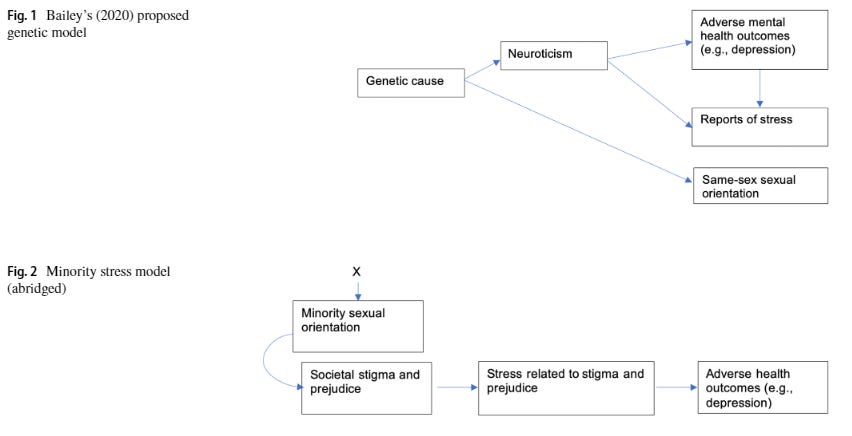
This is from a response by Ilan Meyer, who seems to be one of the most prominent scholars on minority stress theory. He is not amused by Bailey’s idea. He believes that minority status really is causal to poor mental health in sexual/gender minorities. Meyer says that “research on structural stigma has bypassed the biases introduced by self-reports by identifying stigma with objectively measured indexes of societal conditions, cultural norms, and institutional policies affecting sexual minorities”. I will review the evidence he provides for this claim.
They looked at the National Epidemiologic Survey on Alcohol and Related Conditions (NESARC; N = 34 653) study to see if there was a stronger association between sexual minority status and psychiatric disorders in US states with higher levels of “institutional discrimination”: “The study considered 2 markers of institutional discrimination in the form of state-level policies that do not confer protection to lesbian, gay, and bisexual individuals: (1) hate crimes that exclude sexual orientation as a protected category and (2) failures to ban employment discrimination based on sexual orientation.”
There were 577 gays, lesbians and bisexuals in this study. Young and more educated people were a lot more likely to be sexual minorities (Table 1). Sexual minorities were also much more likely to have psychiatric disorders, nominally the largest effect was present for drug use (Table 2). And these are the main findings (state policy*orientation interaction effects, that is, are gays in less legally protective states better off mentally?):

In the authors’ own words: “Compared with living in states with policies extending protections, living in states without these policies predicted a significantly stronger association between lesbian, gay, or bisexual status and psychiatric disorders in the past 12 months, including generalized anxiety disorder (F= 3.87; df= 2; P=.02), post-traumatic stress disorder (F= 3.42; df = 2; P=.04), and dysthymia (F= 5.20; df = 2; P=.02). Living in states with policies that did not extend protections also predicted a stronger relation between lesbian, gay, or bisexual status and psychiatric comorbidity (F= 2.47; df = 2; P=.04).” But anybody can see that this is a p-hacked finding. You have 35k participants, plenty of statistical power, you don’t do any multiple testing correction. You have a lot of researcher degrees of freedom – they could have looked at states with just 1 policy as an alternative, define policies in other ways, or just look at other illnesses if they had wanted to. And yet what you come up with are two p=0.04 and two p=0.02 effects. This is a null finding, folks. Good design, but what it’s worth it shows that gays in more protective states are NOT better off.
Perales & Todd (2018): Structural stigma and the health and wellbeing of Australian LGB populations: Exploiting geographic variation in the results of the 2017 same-sex marriage plebiscite
There was a plebiscite in Australia in 2017 on same-sex marriage. There were 150 electoral districts. The percentage of people voting “no” on this was used to look at how discriminatory a district was. The they looked at data in the “Household, Income and Labour Dynamics in Australia (HILDA) Survey” (N~15k to see if gays in more discriminatory district reported worse mental health. There were 554 gays and bisexuals. Main results:

Model 1 looks at minority status (LGB or other orientation vs. hetero) and “no” voters in the district as predictors. Life satisfaction, mental health and overall health was self-reported and it was a confident 0.4 SD lower in sexual minorities and also areas with more “no” voters were also worse off (p<0.001, very convincing). Model 2 introduces an interaction term. This shows how much the minority-straight gap changes per 1% of extra “no” voters. The coefficient is negative, which shows that the more “no” voters are in a district, the larger the straight-LGB gap (but not the straight-other gap, that actually even diminishes!) gets. There is a nice figure illustrating it too. But once we introduce perceived social support as a covariate, the effect diminishes. That is, as long as gays say they get enough social support from others it doesn’t matter if they live in an otherwise bigoted district.
Now this is not literally a null finding but I don’t find it convincing. The most likely alternative hypothesis is that gays just self-select for living in more “tolerant” areas and those that remain are somehow more problematic. The fact that controlling for social support makes the interaction goes away is in line with this (although also with many things). Saying that you have a lot of social support is obviously also a proxy for good mental health/low neuroticism.
But there is a more obvious problem. The authors say: “analyses were repeated using the variable capturing the percentage of ‘No’ votes out of all registered votes (instead of all eligible voters). Although the pattern of results remained similar, the effects of structural stigma on mental and overall health were less precisely estimated and only marginally statistically significant in these specifications (Table A8). This suggests that, despite a high correlation between the two variables (r = 0.98), (i) the percentage of ‘No’ votes out of eligible voters rather than registered votes may be a better indicator of the concept of structural stigma, and (ii) those failing to provide a vote in the marriage law survey are better conceptualized as not contributing to minority stress.” So actually “percent of ‘no’ voters” is relative to all voters, and once you change this to voters who actually registered (which seems to be a higher quality, more reliable sample, bigots obviously line up to cast their vote unlike people who don’t care about the issue) the effects mostly go away.
So this is a nicer study but doesn’t really falsify any hypothesis alternative to minority stress.
This is based on an internet survey of men who have sex with men (N=123k). Most (106k) live in the country where they were born. Of the 16500 that moved, 71.5% moved to a country with lower levels of “structural stigma”. 78.4% of responders identified as gay.
People in countries with more structural stigma were more depressed and suicidal, with convincing effect sizes. Intercepts were also high with 15-20% even in the most tolerant countries, this goes to about 30% in the least tolerant ones. 3 moderators were investigated: 1) identity concealment, 2) internalized homonegativity, 3) social isolation. These all moderated the stigma—>mental health association, except identity concealment for depression. But the direct effects also remain significant for 1) and 2) on depression (and maybe even 1) on suicidality, p=0.047). P-values are convincing.
Among people who moved to a lower-stigma country, the stigma-health association only persisted in recent movers (<5 years). But interestingly, the indirect effects through the mediators didn’t really decrease.
I don’t think there is a serious statistical problem with this paper, but this design is just not good. Obviously, selective migration should be a big deal with gay people and highly selects for all kinds of good traits (is it the more or the less talented and psychologically healthy gays who can get out of Iraq?), so like with the Australian study, many results are baked in the cake. The same goes for these moderation effects. Obviously we are just picking up alternate markers of mental health with these questionnaires. Controlling for mental health, gay people from less tolerant countries don’t have worse mental health, duh.
This study actually enabled a very interesting analysis though, which is hidden in the supplement. What happens to gay people who travel from a more tolerant country to a less tolerant one? The authors’ words: “Among respondents who moved from lower-to-higher structural stigma countries, there was a significant association between country-of-origin structural stigma and risk of depression (adj. β=0.17, 95% CI: 0.07, 0.26) but not for suicidality (adj. β=0.01, 95% CI: -0.11, 0.12). Neither of these associations were significantly moderated by number of years living in the current country of residence (depression: adj. β=-0.26, 95% CI: -0.62, 0.11; suicidality: adj. β=-0.16, 95% CI: -1.39, 1.07).” So: mostly nothing. They are depressed (but not suicidal) like their country of origin would predict, regardless of how long they live in the less tolerant country! Now if they could have shown that such a move between countries has a dose-respondent relationship with depression that would have got me thinking! Imagine that you move from Sweden to Russia with your gay partner (which seems to be the typical arrangement, according to the data these people mostly move with/to be with a partner or as a child) – does the stigma you suddenly experience make you feel worse? According to this data, it doesn’t. In my view, this should happen under the minority stress hypothesis, and if it did, it would have landed this paper on the cover of Science, got the authors a lot of recognition, not to say do a lot to convince me about the minority stress hypothesis being true.
Overall, nice study, but unconvincing design, and where it could have been convincing, it didn’t deliver.
In the early 2000s (2004-2005) a series of US States banned gay marriage by changing their constitutions. Apparently even California did this as late as 2008 – how the times change! Anyway, NESARC (from a previous Hatzenbuehler study) was repeated in 2004-2005 and a representative sample was surveyed again, including some sexual minorities (N=577 in total, interestingly exactly the same amount as in the first wave despite this being a longitudinal study with attrition. Did all the gay people really come back for the second wave?) Question is: did psychiatric problems increase 1) specifically for gay people 2) specifically in the states that banned gay marriage? Now this is a really nice design! Its philosophy is very similar to the “migrate to Russia” scenario in the previous study: does your mental health really get worse if you are exposed to more stigma by having people your sexual orientation banned from marrying?
The authors say yes, but actually no. They result to a lot of p-hacking and a very basic error (which they obviously know was an error because they literally did the proper analysis in their previous study of the very same database; they obviously omitted it here because it didn’t deliver the results they wanted.
What do the results really say? Well, mental health got worse in these 3 years. Let’s look at heterosexuals in states which did not ban gay marriage. They are the baseline. Mental problems just became more common even for these people. (It is the AOR – adjusted odds ratio – you want to look at. This being above 1 means increasing odds of mental illness.)

The main results – homosexuals in states with bans and in those without bans – look like this:

As you can see, in both groups mental health got worse. Of the 12 possible diagnoses (based on self-reported symptoms on a structured interview, so about halfway between a simple self-report and an actual medical registry entry) 11 got worse in states with bans and 9 in those without (A Fisher exact test with these numbers and a 2x2 contingency table yields p=0.59 BTW). Of course a simple p<0.05 threshold is used here, and power is limited – look at those confidence intervals! While the trends are similar everywhere, 5 disorders reach significance in states with bans and 2 without bans. So where is the interaction analysis which tells us if this is even significant? There isn’t one. This is a very basic error which every first year PhD student knows about. Just because an effect reaches significance in one subgroup but not the other, it doesn’t follow that there is an effect in one subgroup but not in the other. Maybe this is just random sampling error: you need an interaction analysis.
“This fallacy occurs when a significant and non-significant correlation coefficient are assumed to represent a statistically significant difference but the comparison itself is not explicitly tested.” – Dictionary definition of the interaction fallacy
“The prevalence of comorbidity increased significantly among LGB respondents in states with amendments (OR= 2.0; 95% CI=1.22, 3.28) but was unchanged in states without amendments (OR=1.28; 95% CI= 0.71, 1.74).” – From the article. Shame on you, Hatzenbuehler!
There is not much else to say about this article. It is a good design but – due to a combination of low power and bad statistics, strategically used to deceive the reader – it is a null result. Banning gay marriage, from what we can see and despite what the authors claim, does NOT increase mental health problems in sexual minorities.
Some US states (Utah, Michigan and North Carolina) passed laws which enabled officials not to serve sexual minorities (for example, not issue marriage certificates or not handle adoption claims) if they didn’t want it. Indiana also passed a similar law but also an anti-discrimination law so it was not considered and two other states did not have health data. Six control states were included for comparison.
During this time (2014-2016) the CDC ran a Behavioral Risk Factor Surveillance System in these states (basically a questionnaire series about mental health problems from what I gathered). For the outcome variable they dichotomized (bad move) “days with poor mental health” at 14/30.
The question is: did poor mental health selectively increase 1) for homosexuals only 2) only in the states which passed these bans? The main results look like this:

The key statistic is a “difference-in-difference-in-differences” (homosexuals in control states (dark blue) and in the ban states (light blue) vs. heterosexuals in the same states). This is basically an interaction effect. The p-value is… drum roll…. 0.046.
The authors make a lot of the effect size (homosexuals have 50% worse mental health in just 2 years because of these very basic laws, hard to believe!) but this is just obviously a p-hacked study. They do some sensitivity analyses but we don’t know what if they had chosen other control states, other control periods, a different cutoff for the binary “bad” mental health etc. Notably, they re-discovered interaction effects (actually a fancy economist version of it even) now that they could massage a “significant” result out of them. Once again: I think the serious interpretation is a zero effect. Nice design, but no evidence that these bans make homosexual mental health worse, and as in the other studies, this is mostly because the sample is just too small.
There is a longitudinal study in Chicago called the CHLEW. It studies lesbians. During data collection for its third wave (2011) Illinois passed a law legalizing civil unions. (Actually, there are 2 stages of this: when the billed passed legislation (January) and when it was actually enacted (May)). The question is: do the lesbians interviewed before passing/enacting this bill have worse mental health?
There were 4 measures of mental health: 1) Stigma Consciousness 2) Perceived discrimination 3) Depressive symptoms 4) Hazardous drinking. You can probably already see where this is going. The main results look like this (irrelevant predictors cropped):


Model 2 and 3 introduce some strange demographic interactions so Model 1 is the most informative. There is a credible effect of bill enactment decreasing stigma consciousness (p<0.001). There is a sputtering of p<0.05 effects for drinking, some actually not even in the expected direction, and maybe the legislation specifically reduced adverse drinking consequences.
The authors take everything, even p<0.1 things at face value. If only Model 2 or 3 had a significant main effect, they just said that “well, there is a race/education/whatever interaction for some reason”. In fact, the results are very unconvincing. There was plenty of room for p-hacking: two exposures (signing, enacting), seven outcomes, plus many subgroup analysis to mine – what if the effect is there in blacks? What if it is there in the highly educated? Some effects could still be convincing, but they aren’t – the pattern doesn’t make sense. Why is it the signing that affects some problems, and the enactment which affects others? Why are the results so selective – isn’t minority stress supposed to affect mental health in general? Why do some indicators even get worse? I don’t think there is any theory that could predict this pattern of results – well, actually there is one, the authors really wanted an article that showed these results so they wrote one around the two not obviously spurious effects that they found (p<0.001, for bill enacted—>stigma and bill signed—>adverse drinking). A generous reading of the results might assume that because the bill and sexual minorities were presumably the topic of conversation when this study was conducted, participants really felt like they needed to endure less stigmatization. But even for this there is neither theory nor a replication.
This is not as obvious as in case of geographical predictors where selection migration is just an obvious confounder, but I’m wondering if there is room for collider bias in a study like this. Is sampling really random, isn’t there perhaps some bias in more “problematic” people to answer the call for a study of mental health faster?
Overall: we are getting used to this pattern. Nice design, good data, somewhat low power, but a lot of p-hacking and going way beyond the data to get the desirable result. Still no convincing evidence that enacting a civil union bill improves sexual minority mental health.
The CDC runs the Youth Risk Behavior Surveillance System(YRBSS) which monitored adolescents 1999-2015, including for suicide attempts. The question is: when a state implements a “marriage policy” (allows gay marriage) do youth suicides drop? The results look like this:

Nothing great, but you can see that the means start lower after the vertical blue line and the effect is significant: -0.6% for all students (upper CI 0.1 so just p<0.05) and -4% for sexual minority students (p<0.01). There appears to be a proper interaction term this time, with p<0.01! But the story doesn’t end here.
The authors run very reasonable sensitivity analyses to see if shifting the policy time affects results. What happens if we look at states which will introduce changes in the next 2 years?
My original discussion of what happens was very dismissive. But upon reading the paper again, I realized I misunderstood the sensitivity analyses and they support the authors’ point. My original analysis is below, in strikethrough, so you can contemplate my foolishness. You can still read the tables there.
A lead/lag estimate the main effect (on both heterosexuals and others) of laws, shifted by some years. If significant, it simply means there is a time trend. The crucial figure is the lead/lag*sexual orientation interaction: this indicates whether the effect of the law is stronger in sexual minorities, as expected under the minority stress hypothesis. You’d want a lead*minority effect to be non-significant (minority mental health is not disproportionately affected before a law is enacted) and a lag*minority effect to be significant (the effect of the law persists years after it is enacted). You don’t really care about the lead/lag main effect (the pooled effect in the population) and it’s normal to only run the minority interaction effects for states with minority data. By these standards, the sensitivity analyses are OK. One additional thing I noticed, however, is that YRBS also asks another suicide question (“having seriously considered suicide”) which is not used, my hunch is because it didn’t deliver the desired outcome.
The authors say that “a lead indicator for states implementing same sex marriage policies in the following 2 years was not associated with suicide attempts among all high school students or among students who were sexual minorities (eTable 6 in the Supplement)”. Sounds convincing, right, no findings where there should be none, right? Actual eTable 6:

So yeah, there was no effect overall, but there totally was one (well, p<0.05, but this is what we see in the main analysis as well) for states which have minority data!
Next: “A lagged indicator for states implementing same-sex marriage policies 2 or more years prior was significantly associated with reduced suicide attempts (–0.7 percentage points; 95%CI, –1.3 to –0.2 percentage points), indicating that reductions in suicide attempts persisted over time in the years following implementation of same-sex marriage policies (eTable 7 in the Supplement).” Actual eTable 7:

I’m not seeing their numbers in this table (maybe a rounding issue from the “all states” data?) but this is really fishy for other reasons as well. There was no persistent effect in the states with minority data, and even in the total sample it was a Hail Mary p<0.05. The upper CI is <0.001 (probably <-0.001, if there is no minus then it actually straddles zero). I’m not seeing a persistent effect here, and as the authors’ own analysis shows, the models could be very easily tweaked to show that marriage policies improve suicide attempts even before they actually happen.
This was the last paper I read and also the one where the errors or misleading strategies required the most technical approach. There is a lot of room for p-hacking and creative analysis in these studies and from what I have seen I must assume that the authors use them all. For example, why do they use a linear model for a binary outcome instead of logistic? (They give a hand-wave explanation but this is still highly unusual). Why not use other outcomes outside suicide? I must assume that they tried many and this was the nicest. There is a lot of data here, why are the p-values so borderline? P<0.01 is the best they could find.
Conclusion
I don’t think I became an instant expert on the minority stress hypothesis overnight. However, Ilan Meyer definitely is one, and these are the studies he cited in a recent (2020) paper in support, so my understanding is that this is the best evidence for it. If this is the case, then the minority stress hypothesis is on very weak footing. Most of this evidence is correlational and easily explained with things other than minority stress, for example selective migration of sexual minority members with better mental health. The pseudo-experimental results are underpowered, p-hacked and frankly often just deliberately misleading. It is clear that there is a very low standard for publishing “fancy design shows that progressive politics makes gay lives better” findings – authors, editors and funders all want these, while I assume it is much harder to publish negative findings in this topic.
In my view, the best method for causal inference in this topic still lies in genetically informed samples. If in MZ twins discordant for sexual orientation the homosexual member doesn’t tend to have poorer mental health (or E correlations are close to nil), then we have fully falsified the minority stress model. In this model, he should be the one discriminated against and consequently he should have worse mental health – if this is not what we are observing, then there is nothing to talk about, it’s all a familial confound. An MZ twin difference or a significant E correlation is compatible with the minority stress model, but even that case further work is needed.
Good post. One modification: I don't think the original cause need to be genetic, although genes are part of it. See my response to Meyer: https://rdcu.be/ceJm9
One thing missing is that homosexuality in men is likely related to brain masculinization under prenatal hormonal influence rather than genetics. So, because of their feminized brains they are higher in trait neuroticism. Gay men are tilted towards the female neurotic average. There is a new papers in the Archives of Sexual Behavior supporting this: https://link.springer.com/article/10.1007/s10508-022-02319-2