Being a Roma is in the eye of the beholder
What kind of people are falsely seen by others as Gypsies?
In one of my previous posts I noted something I hope was surprising to readers: in Hungary and in other Eastern European countries, it is somewhat ambiguous who even belongs to the largest ethnic minority, the Gypsy/Roma minority. In the most recent census, 3.18% of the population considered themselves Roma, but there are lots of claims that this number is higher – this idea is so prominent that it sits right in the header of the English Wikipedia article on “Romani people in Hungary”. Surprisingly, it is not a controversial idea that there are “phantom Gypsies”, people who don’t consider themselves part of this ethnic group but others know better.
I managed to take a look at a great dataset which contains data on identification as Gypsies/Roma by the participants themselves and separately by their interviewers. This is an amazing survey of 8000 people in Hungary, resulting in a dataset of over 1000 variables, mostly opinions about custom questions ranging from their willingness to having children to their opinion on Donald Trump or when they went on their first date. And this is just the 2020 wave and there is a new one every 4 years – I have the last 3 and I will mainly look at the 2020 one.
A very interesting feature of my dataset is that the surveys are done by an interviewer who gives his/her opinion on the interviewee about some things. Most importantly, participants report if they consider themselves Roma, and the interviewer gives his own assessments. The agreement was not great, in spite of the fact that the interview was verbal so the interviewer literally heard what the participants said about their ethnicity before giving their own rating (granted, this was just one of a thousand questions):
Annoyingly, the other earlier 2012 and 2016 waves are a bit different. The 2012 wave asked interviewers about ethnic identity, but these questions are missing from the dataset so I cannot use it at all. The 2016 wave has different variables so I have to sit down to analyze it on its own, but the discrepancy between self-ratings and other-ratings replicates and it is actually even bigger, with interviewers reporting over three Roma for each who self-identified as such:
Even the 2020 numbers correspond to a tetrachoric correlation of 0.84 and a Cohen’s kappa of 0.34 which is definitely not great. The numbers are boosted by the fact that most respondents were not Roma by their own or by the interviewer’s assessment – 3.86% rated themselves as Roma, very much in line with census numbers, while interviewers said that 4.79% of the respondents were Roma, so it is indeed true even here that external observers see “phantom Gypsies”. However, the majority of self-rated Roma were not seen as Roma by interviewers, and most of the people interviewers said were Roma did not rate themselves as such. Today, we will look at what causes this discrepancy.
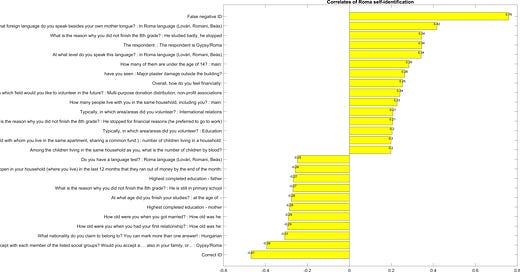
I was flying a bit blind here because we have over 1000 very heterogeneous variables – mostly binary, some ordinal – so I just decided to look at what variables correlate with Roma self-identification, identification by others, and discrepancies in the two identification methods. (There is a lot to criticize about this strategy because many variables are ordinal and some even categorical and in case of binary variables Pearson correlations are biased by category frequency, but I was hoping on picking up a valid signal anyway.) I excluded variables with less than 50 valid observations. I’m showing the top 15 positive and the top 10 negative correlations because I have to draw the line somewhere, if you want the full tables they are here. Variable names are machine translated from the original, I hope they are understandable enough, I will explain a few. These are the variables most associated with self-identification as a Roma:
Correct ethnic identification (interviewer and interviewee say the same) was negatively and incorrect positively associated with being Roma because most people said they aren’t Roma – this is an artifact. Speaking the Romani language, being rated by the interviewer as a Roma, having low education, many people, especially children in the household, plaster damage on the house, accepting attitudes to Roma (this is a negative correlation due to how this item is coded), low education of parents, early initiation of dating and marriage were the variables most strongly associated with being Roma. This is very much line with the stereotypes I think.
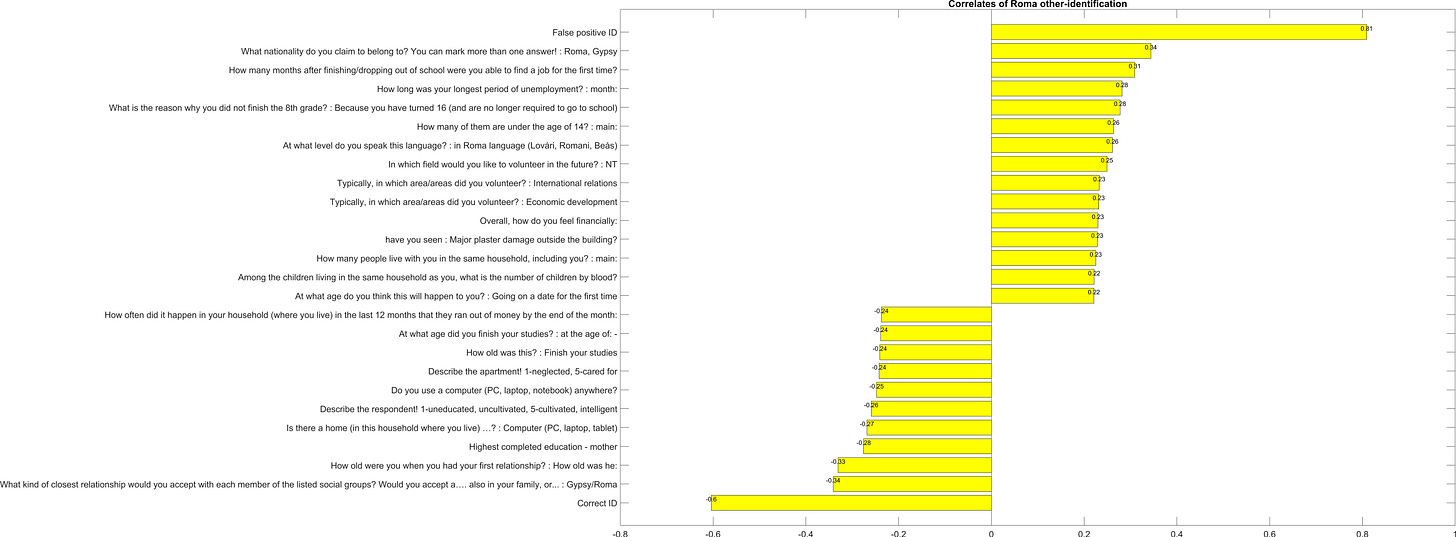
Are interviewers noticing the same things when they assess the ethnicity of their clients? Sort of, I guess:
Interviewers also base their judgement on low education, speaking the Romani language, warm attitudes to other Roma and many people in the household, but they weigh other things more heavily which I would summarize as a lack of middle-class values: unemployment, no digital devices at home, dropping out of school at the age of 16 (the end of compulsory education in Hungary) and a neglected dwelling with structural damage. There is also something else interesting here: interviewers rate their clients on subjective intelligence, which pops out as one of the strongest negative correlate of being seen (but not seeing ourselves, with that the correlation is somewhat lower) as Roma. We will get back to this because there are other similar questions which we can use to build a latent measure of subjectively assessed intelligence. (Note also BTW that the Pearson correlation of the binary vectors of self- and other-identification is the same as the Cohen kappa, 0.34, but this is an accident.)
The next thing worth doing is to look at correlates of giving a wrong assessment of ethnic identity. First: what kind of non-Roma are seen as Roma by interviewers? I restrict these analyses to the 7691 people who did not rate themselves as Roma.
Non-Roma who have warm attitudes to Roma, drop out of school, are unemployed, start dating and marry early, don’t have digital devices at home and live in poor conditions and dilapidated houses are the most likely to be seen, falsely, as Roma. While some of these variables are in line with the “phantom Gypsy” view – maybe some Roma hide their identity due to stigma or shame but they actually are Roma – others are just standard indicators of low socioeconomic status. It seems like in the eye of the beholder “Roma” often just means “poor”.
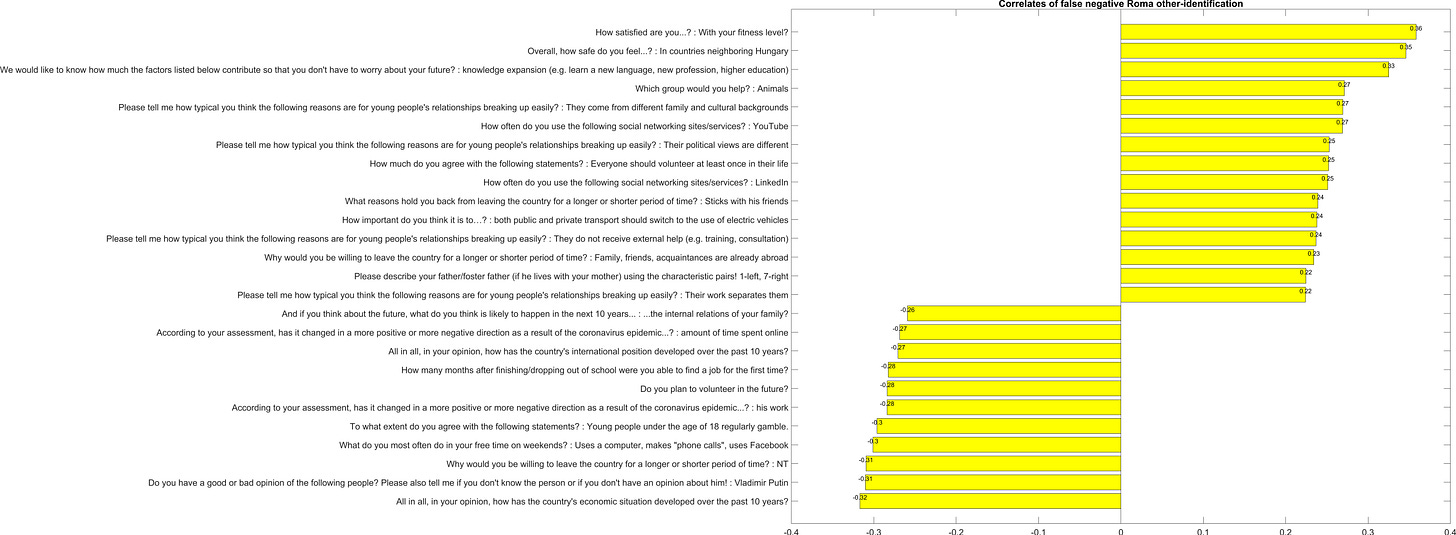
What about false negatives – Roma who were not seen as such by the interviewers? To avoid confounding the analyses with the thousands of correctly categorized non-Roma, these analyses are restricted to self-rated Roma (N=309) who were either correctly or incorrectly seen by interviewers as such, and we are looking at what correlates with this.
These are somewhat different things! I guess the best way to summarize what’s going on here is that Roma who exhibit signals of belonging to a modern, successful, cosmopolitan middle class are less likely seen as Roma. We see many signs of this: fitness, internet use, being comfortable travelling abroad, altruism to animals, a lower opinion of Putin, and, most importantly, increased optimism about the changes that occurred due to Covid, and about the country’s economic situation.
Did the same variables predict true positive Roma self-identification as false positives and false negatives? Partially:
We are seeing here a sort of correlated vectors analysis: a correlation of correlations. The variables illustrated are: self-reports (SRep), false positives (FPos) or false negatives (FNeg) and each dot shows one particular variable and its correlation with two types of ratings. Of the 814 variables with sufficient data, very similar ones were associated with actually being Roma as with falsely being seen one (r=0.78). It looks like interviewers look for stereotypical signs of Roma identity in their clients, but sometimes make errors. They generally cast their net too wide, see about 30% more Roma than there really are out there based on self-reports, and probably pick up a mixture of Roma who hide their identity and run of the mill poor people.
On the other hand, falsely being seen as non-Roma is about more than just not showing these signs of low socioeconomic status. If this was the case, we would see a strong negative correlation between what correlates with false negative ratings and what correlates with self-reports: this correlation is in fact 0. Based on the list of variables associated with false negatives we could speculate that there are signs of flourishing – not just not being miserable – that interviewers think is incompatible with Roma identity, so if somebody is in tune with modern society and optimistic about the future they are likely to chalk this person down as non-Roma. The slight negative correlation (r=-0.14, but still p<0.001) between false positive and false negative associations suggest that there really are some characteristics only interviewers believe are associated with being Roma, so they bias their judgements based on whether a client has them or not.
Intelligence and other characteristics
Material living conditions were clearly the most important thing that made interviewers say that some participants were Roma – often, but not always, correctly. But correlations hide how strong these associations are, so I want to look at some specific things interviewers reported about the dwellings of people they met. Interviewers were asked about the physical condition of the houses they were received in. Here are the frequencies of some problems in the total sample and the odds ratios (from binary logistic regression models) of having this problem if the interviewee declared himself as Roma:
- Support beams (to prevent collapse): frequency 2.76%, OR=4.96
- Falling plaster inside the house: frequency 4.8%, OR=7.98
- Falling plaster on the outside of the house: frequency 8.9%, OR=10.8
Living in dilapidated houses was not common enough in the sample to jump out in correlations as strongly associated with Roma identity, but the effect sizes are huge, these problems are much more common among the Roma.
Interviewers also rated the houses they visited on a 1-5 Likert scale as “Dark/Bright”, “Neglected/Orderly” and “Cramped/Spatious”. The mean rating for non-Roma was almost exactly 4 for all of these, both for Roma, it was 0.76 points lower for dark-bright and cramped-spatious, and 1.1 points lower for neglected-orderly.
How about intelligence?
We don’t have a proper intelligence test in this sample. What we have is intelligence subjectively rated by another person. Subjective self-ratings are known to correlate at 0.3-0.4 with actual intelligence measures, and most papers like this old one find similar or somewhat lower estimates for the accuracy of other-ratings (there is a chapter on this in this book). This is not great, not terrible. It is probably interesting enough to look at.
Interviewers had not one, but six questions about client intelligence: they were asked if they 1) are not knowledgeable in politics, 2) had trouble understanding the questions, 3) are educated and intelligent, 4) answered quickly and easily, 5) were cooperative and friendly, 6) thought like adults (as opposed to thinking like children). These were all rated on a 1-5 Likert scale. While there is lot of subjectivity to these questions, the responses come from people who visited others in their houses and asked them over a thousand questions in a long interview so I think this is reasonably good for a subjective intelligence assessment “battery”. The scores had a clear positive manifold and a single principal component accounted for 65% of the variance. I will use scores on this first principal component as a measure of other-rated, subjective intelligence.
In this measure, self-identified Roma were almost exactly 1 (1.014) standard deviations below non-Roma. Interestingly, this number was almost exactly the same (1.021) for other-ratings. If entered in the same model, both have strong independent regression coefficients (-0.71 for self-reports and -0.8 for interviewer IDs). Among Roma, there was only a -0.02 SD difference between those we correctly rated as Roma and those who were incorrectly not rated as such. All this shows while Roma were rated as much less intelligent than non-Roma, this was not what primarily drove ethnic identification by others.
A logical question is if the worse conditions of the Roma can be accounted for by lower intelligence ratings – in other words, if a Roma seen as equally intelligent to the average non-Roma would be expected to have similar living conditions. The database doesn’t have great variables for operationalizing “living conditions” – everything is subjective and at best ordinal – but from what I could see, the answer is “no”. Roma ethnicity and other-rated intelligence were significant independent predictors of poor housing conditions (the interviewer ratings I described above), satisfaction with income, and education. Either interviewer ratings don’t capture intelligence accurately, poor Roma living conditions are not only caused by low intelligence, or – what I think is the most likely – a combination of both.


