What makes a real psychological construct?
A commentary to William Revelle on the reality of g

Lots of psychometric data allows the extraction of common factors – basically a consensus rating of parallel measures on something they all measure. This is true in the case of personality, psychiatric disorders, and – most famously – intelligence. Some people, including psychometrician William Revelle in a recent piece, argue that just because you can extract such a common factor it doesn’t mean that this reflects a real construct like “general intelligence” or a “general factor of personality”. I argue that this can be decided by investigating the correlations of common factor variance with external indicators. If the common factor reflects a real construct, then once we extract it, the remaining information doesn’t predict much. By these standards personality or psychiatric disorders don’t really have a common factor, but intelligence does.
In 1904, Charles Spearman published one of most important discoveries in the history of social sciences. Although we tend to think of talents in things like mathematics, languages and music as separate, independent abilities, Spearman noticed that school grades in all subjects are positively correlated. Not only that, but better students also had better musical talents and pitch discrimination ability. Here is his original table:

This phenomenon, where performance in all cognitive tests correlates positively, became known as the positive manifold. On average, people who have better memory also have better arithmetic skills, people who have better vocabulary also have fast reaction times, people who are better at puzzles also know more about society and politics – you can imagine any pair of similar abilities, despite valiant efforts psychometricians really couldn’t find any exceptions.
The positive manifold is one of the best replicated findings in psychology. Sadly, but reflecting the standards of this field, from most universities you can easily graduate as a psychologist or an education specialist without knowing what the positive manifold is, or at best they will spurt all kinds of intellectual squid ink on you about how other theories of intelligence with much weaker foundations are somehow equally important.
Once you have a positive manifold, you can extract a common factor. “Extracting a common factor” is a fancy way of saying that you think the correlations exist because all the things you measure reflect a single common trait, so you try to use the data you have to estimate people’s scores on this single causal trait you cannot directly measure. Spearman thought the “single trait” was g, general intelligence. In his theory, the reason school grades and musical ability correlate is because there is a domain-general single “intelligence” you can use to get good at any school subject or get any talent. If you have more general intelligence, the effect of this will reverberate across multiple ability measures. There are specific talents as well – he called these s-factors – but these by definition only affect one grade or one ability.

Spearman’s idea of a general intelligence. Grades in the classics, French, English, math, pitch discrimination ability and musical talent (C-T) partially reflect a general cognitive ability (G). G is the common factor. If you add up scores on C-T weighted by the path coefficients c-t, you get estimated scores on this G common factor. The specific ability C-T only partially depend on G. The question is, is the part of them which is G-independent good for anything?
This is a nice idea, but the fact that you have a positive manifold and you can extract g doesn’t mean any of it is real. These are just mathematical transformations: once you have this matrix of all-positive correlations, you can always extract a single common factor. This doesn’t automatically mean that there really is a real causal trait like “general intelligence” in the background, lots of other things can explain this finding. Soon after Spearman, people raised issues with g theory. Godfrey Thomson, for example, basically argued in his sampling theory that the positive manifold only exists because the mental exercises that make up intelligence tests are poorly designed. Abilities really are independent, but in order to answer a vocabulary item you have to use both reading ability and memory, for a matrix item you have to identify patterns and use logical rules and so forth: you need multiple, originally independent abilities for every mental exercise we can design, so your performance will depend on several of your abilities which in turn will become correlated in the results. More modern versions of “g is not actually real” theories are the mutualism theory by van der Maas (which claims that we are born with independent abilities and the positive manifold emerges during development) and process overlap theory by Kovács & Conway (which, very similar to Thomson, claims that multiple independent abilities are always recruited in testing, giving the illusion of a general intelligence).
In a recent article, veteran psychometrician William Revelle also warns against “reifying” common factors. He reminds us that just because we can mathematically extract a common factor from correlated variables, it doesn’t mean that there is a real unmeasured causal trait in the background, and extracting the common factor is not even necessarily the right thing to do. He is of course right in theory and brings up good examples from personality research. But I think his broadside at general intelligence is not well-founded. Applying his own standards to cognitive abilities doesn’t weaken but in fact supports the case of general intelligence as a real ability. Below is my detailed take.
Validity versus information content
It is often an unspoken goal, but the goal of psychological measurement still is to predict real things people do. A personality or intelligence test is supposed to measure things like how well an employee will perform, while a psychiatric screening test might identify patients with depression. The problem is that simple psychological measurements have poor signal-noise ratios. Normally, personality and psychiatric problems are measured using self-report questions and cognitive ability is virtually always measured using puzzle-like items with right and wrong answers. A single item (such as “I like going out with people” or “I have little will to live”) contains little information about traits, and there is a lot of noise resulting from nuisance factors such as how different people even interpret these questions. So normally we aggregate several such questions with similar content into a longer scale. Extraversion, depression, and cognitive ability are all measured by several items. As we add more items, reliability – the proportion of common variance relative to total variance, or simply put the signal-noise ratio – goes up because the shared variance adds up but unique variance is diluted out.
This sounds great and in fact you can approach perfect reliability by just increasing the length of your scale. You can also increase reliability (or reduce the length of the scale needed to attain a reliability level) by choosing items with higher correlations. Higher correlations show that the items have more in common, which is what we are aiming at.
But there is a catch: this is only a good idea if the shared variance was important and everything else the single items measure is noise. If “depression” predicts, for instance, suicide risk, and if “extraversion” predicts how well a manager will perform, and everything else that affects your responses on the items designed to measure these traits is garbage, then of course you want to measure “depression” and “extraversion” as reliably as possible and get rid of everything else. But what if this is not the case? What if managers who agree more with the statement “I love to work with people” perform better even if they have the same overall extraversion score? What if people who agree more with “I’m thinking about killing myself often” are at greater risk of suicide, even with the same overall depression score?
Revelle demonstrates this phenomenon on this chart:
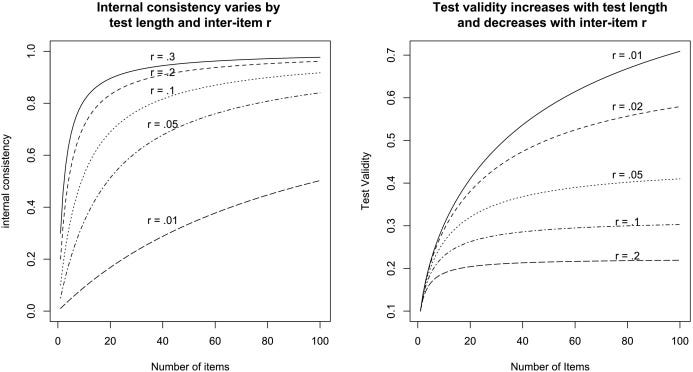
Reliability and validity have tradeoffs. On the left, we see that reliability – the proportion of common variance – goes up with both the number (horizontal axis) and the similarity (separate lines) of items. On the right we see that validity – how well we can predict other things – also goes up with the number of items, but it actually goes down with item similarity. If we only include items in our test which measure similar things, we sample a smaller universe of potential predictors.
This leads us to a very important observation: reliability is to some extent similar to redundancy and it can be a bad thing. It’s not always a good idea to just get the consensus score of your parallel measures – a composite or factor score – and go with that. You have to empirically test if aggregating scores or extracting common variance was a good idea to begin with. It was a good idea if a lot of useful information is captured in the aggregate score and there is little left in what remains at the level of unique item variances. If an “extraversion”, “depression” or “intelligence” score predicts, for instance, work performance or suicide risk and the information we left out from aggregation – item-specific information – doesn’t add too much, then it was a good idea to aggregate. Not only that, but if the aggregate score captures the useful information in the test and doesn’t leave out much, then we have evidence for the reality of “extraversion”, “depression” or “intelligence” as well. If the common factor is only a mathematical illusion, as Revelle claims is the case sometimes, then why is it so special? On the other hand, if the unique information left out from these aggregations is still useful in making predictions, then we are left wondering if aggregating made any sense in the first place.
We can hold all positive manifolds to these standards.
The positive manifold of personality
This is perhaps less known, but personality shows a positive manifold just like intelligence. Most research on this is done using the Big 5 model. In the Big 5 model, your personality is assessed on the traits “Extraversion”, “Neuroticism”, “Agreeableness”, “Conscientiousness” and “Openness”. These are supposed to be independent traits, but in real data they are not independent at all. If we believe self-reports, we should conclude that some people have “better” personalities, defined by a combination of high extraversion, agreeableness, conscientiousness, and openness, but low neuroticism. For example, in Revelle’s paper:

Big 5 trait intercorrelations (raw below the diagonal, corrected above the diagonal, reliabilities in the diagonal). People consistently report “better” or “worse” personalities, indicated by higher or lower values of all the “good” traits.
Some people theorized that there really exists a “general factor of personality”, meaning that we really can believe these self-reports and there really are people with better or worse personalities. As it turns out, biases in responding probably better account for this phenomenon. People differ not in the overall goodness of their personality, but the tendency to present themselves as good or bad. Your tendency to do this will make you give yourself better or worse scores on items measuring all five personality traits. In addition to your real perception of yourself, this self-presentation tendency will make you more or less likely to answer affirmatively to questions like “I often have sad thoughts” (neuroticism”), “I always perform my duties well” (conscientiousness), or “I like hanging out with people” (extraversion). I think the definitive paper on this phenomenon is Anusic et al 2009. The authors of that paper show that (in four different datasets!) there is little to no correlation between the general personality factors of self-ratings and ratings by others, and this “general personality factor” correlates with self-rated intelligence, attractiveness, athleticism and knowledge. In other words, while some people rated their personality as just “better”, external observers didn’t agree with these ratings, and people who thought they had better personalities also said they were smarter and better-looking. People introduce their self-perception into personality self-reports and ideally you would always clean this out before using personality scales. One of the authors of the Anusic et al 2009 paper is Ulrich Schimmack, a prolific science blogger writes a lot about this phenomenon.
The problems with personality self-ratings don’t end with the general factor. There are issues even with lower-level personality traits. In his own paper, Revelle shows that extracting traits is a suboptimal way to do prediction: the items contain a lot of important information that disappears when we aggregate them to create personality trait scores. This has been shown in many previous studies, some of them also authored by Revelle: when we measure personality, a lot of important information remains at the item level. There are very small personality traits, also known as personality nuances (imagine things like “having the patience to tolerate annoying people” or “liking the company of friends, but not strangers“) which are only indexed by a few items or just a single one in personality scales. Research has shown that these nuances are consistent across self-ratings and ratings by others, they are heritable and they predict real-life outcomes: in other words, they are real and important.
Despite correlations between personality test items and even a full positive manifold between personality traits, it is suboptimal to mathematically reduce personality to a few traits and leave it at that. A lot of important information is present in scores on major personality traits: but then again, a lot remains at the item level. Personality is not easily reduced to just a few variables and it’s questionable if factor analytic methods can tell us which traits are real. Personality is a good example of Revelle’s thesis that latent variables coming out of factor analysis are not necessarily real.
The positive manifold of psychiatric illness
Something similar can be seen for psychiatric illnesses. The concept of mental illness has been known since antiquity and lots of people came up with ways to categorize patients into discrete disorders. The number of disorders grew over time: Hippocrates wrote about four, Kahlbaum & Heckler in 1863 about 5, Kraepelin at the turn of the 20th century about 15. The first DSM, published in 1951, listed 106 disorders, the second 182, the third 265, the fourth 297 and the fifth 298. It’s probably not a good idea to have so many diagnostic options because based on field trials where the same patients visited several doctors, psychiatrists don’t agree with each other very well on which diagnosis to give even for the main disorders.
But it’s not just that psychiatrists are bad at identifying illnesses. Psychiatric comorbidity is the norm, not the exception, and the same people often have multiple different psychiatric symptoms and diagnoses. This led some to the idea that a “p-factor” of psychiatric disease exists: much like how some people are smarter than others, others are generally crazier, and the difference is a general tendency to mental illness, not in a tendency to specific disorders. (For the record, Wikipedia attributes the idea of the p-factor to this paper, but in fact it already appears in Hans Eysenck’s work, for example this book.)
Perhaps the best attempt to test the p-factor model is a 2022 paper by Grotzinger et al. In this paper, the authors used GWAS data to investigate if a genetic p-factor – the idea that there is a heritable tendency to all psychiatric illnesses – was tenable. The main figure is below.

The Grotzinger team’s ideas about the possible structure of psychiatric illness. Genetic risk for almost all psychiatric disorders overlaps positively (top left). This can be due to various disorder factors underlying risk.
As you can see on the top left panel, there was an almost perfect genetic positive manifold: the genetic variants increasing risk for one disorder increased risk for all other disorders as well (the exceptions were for some reason the pairs of alcoholism-Tourette’s syndrome, and OCD-ADHD). Several models can explain this pattern. On the bottom left, you see the p-factor model: there is a general risk for psychiatric disorders (Pg), this increases risk for disorder groups (F1g-F4g), which in turn increase risk for specific disorders. This looks just like the Cattell-Horn-Carroll model of intelligence. Alternative models assume risks for disorder groups which are correlated for some reason (top right) or independent risks for disorder groups and any psychiatric illness (bifactor model, bottom right).
The way to test which model is best is the way Revelle and I proposed: by testing which one explains correlations with external traits – biobehavioral traits like “sports club or gym attendance”, measures of brain morphology, and circadian rhythms – best. By “explaining correlations” they mean fitting models which look like this:

If the p-factor is real (“common pathway”, on the right), things like going to the gym or having a different brain structure may correlate with this general genetic tendency for psychiatric illness, and with specific disorders only to the degree they reflect the former. You can see this from the fact that correlations of specific disorders (y1g-y3g) with the external trait (Xg) are proportional to their correlations with the common disease factors (Fg). “Gym attendance” or “brain morphology” correlates with general disease risk first: this then trickles down to the specific disorders to the extent these reflect this general disease tendency.
On the other hand, if the p-factor is illusory (“independent pathway”, on the left), no such proportionality exists. Here it is the specific disorders themselves that are related to behaviors and brain morphology, not a general disease tendency (which may just be an illusion) as their common cause. Therefore, disorder-external trait correlations are not proportionate to the loadings of specific disorders on the common risk factor Fg.
As it turns out, the model that fits the data is not the p-factor model, but the “correlated risks” model shown on the top right two figures above. It looks like the p-factor, much like the general factor of personality, is illusory. The reality is that people have risks for more circumscribed psychiatric disease groups, like a shared risk for anorexia nervosa and OCD (“compulsive disorders”) or schizophrenia and bipolar disorder (“psychotic disorders”).
Grotzinger et al’s analysis of the p-factor is another case where, despite a positive manifold, a general factor doesn’t seem like a good explanation of the data. Having seen two illustrations of Revelle’s important warning that this can occur, it is time to look at the original positive manifold, the one surrounding cognitive abilities.
The positive manifold of cognitive ability
We saw two cases above where there was a positive manifold, a common factor could be extracted, but it didn’t really look like this was the right thing to do. There was nothing special about the information contained in the common factor: sure, it was a useful way to aggregate information, increase reliability or reduce the number of variables we had, and the common factors predicted lots of interesting things. Still, the information left out from the common factor(s) remained important. Personality or psychiatric disease cannot be described with a few simple variables.
This makes it all the more interesting how different all this is in the case of general intelligence. Arthur Jensen famously wrote that
What he meant by this is that while intelligence tests contain a lot more information than just common variance – given a same IQ, somebody can be at various levels of vocabulary, memory, reasoning etc. - it is the g-factor that contains the predictive validity of such a test. Intelligence predicts things like school grades, work performance and income: but it mostly does because it measures g. Given a certain level of g, having better memory, mathematical ability or vocabulary is not really useful in life. In other words, he says aggregating is a good idea in case of cognitive testing because there really is a single general cognitive ability that matters – unlike, as we saw above, personality.
It’s worth looking at a few studies which demonstrate that Jensen was right.
Ree and Earles (1991). Predicting training success: not much more than g.
This study used data from almost 80000 people trained by the US Air Force to do various jobs to see how well cognitive abilities predict training success. Everybody completed the AVSAB, ten principal components were extracted from the scores, and we have data about success. The key result for us is the comparison of model 3 and model 4 in this table:
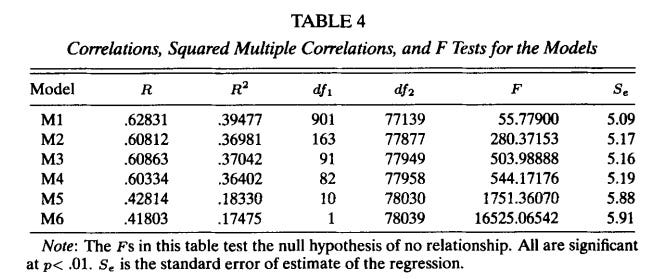
In model 3, all 10 principal components – the g-factor plus nine other cognitive ability factors indexing specific abilities – predicted performance. In model 4, they only used the g-factor. As you can see from the drop in R2, specific abilities accounted for less than 1% of the variance. In contrast, in model 6 the g-factor alone accounted for 17.5 even with big limitations in modelling – to see the absolute worst the g-factor can do, this model assumed that all Air Force jobs have the same level of training success and the relationship between intelligence and success is the same across all jobs.
Simply put, overall smarter soldiers were more successful in training, but once you went beyond “overall smart”, other ability differences didn’t matter much. This is the typical conclusion of such studies: once you know g, other abilities account for zero or almost zero additional variance. You can read this book chapter by Ree and Carretta for other examples on how specific abilities add little to g in predicting training success or job performance, or this recent short review by them.
This very nice new study uses data from a few hundred German students to look at whether grades in school are predicted by non-g abilities measured by the BIF and the BEFKI, two intelligence tests popular in Germany. I also chose this study because it contains an overview of all similar studies from 2000 (Table 3) which confirm the low importance of specific abilities in school.
This is what their main table looks like (cropped to only show one measurement occasion):
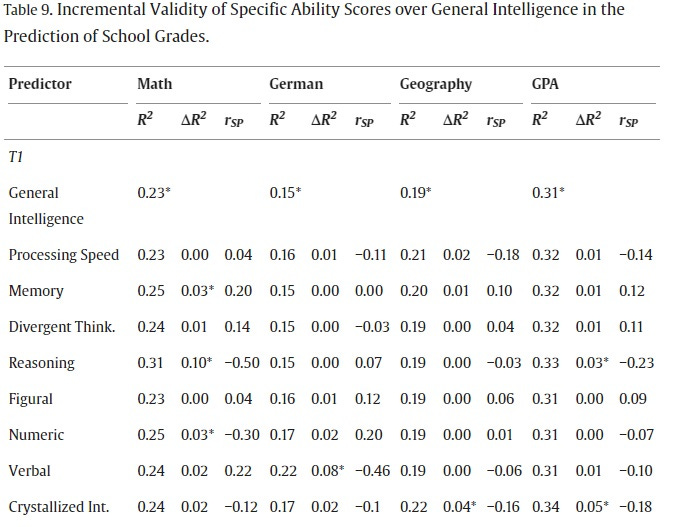
In the first row, you see that general intelligence alone accounted for 15-31% of school grades (the least in German and the most in GPA). In the rows below, you see how this percentage changes (ΔR2) if the specific abilities in the first column are added. Most of the ΔR2 numbers are zero or very close to it. Only a few significant effects are found. Given the same level of g, being better at reasoning is important to be good at math and being good at verbal abilities is important to be good at German. There are also some additional scattered results. Even in these cases, g is several times more important than specific abilities.
You could think that since the school curriculum is structured and can be practiced, even a smart student would benefit a lot from an additional boost to specific abililties. Yet, in most cases specific abilities add nothing to the predictive ability of g.
Note that I’m not saying that specific abilities don’t exist or can never be useful. Some people clearly are better at math or verbal tasks and this shows up in school performance. But for personality traits, the common factors are always “leaky” – it’s not that the predictive validity of personality factors can sometimes be improved a little, non-common information in personality traits always increases their predictive validity. In contrast, for most cognitive demands in the school, extracting g – assuming that there is only one “intelligence” and specific cognitive tests are merely the indicators of it – seems to be the best way to describe why ability is correlated with performance.
I think this is the only paper which investigates whether non-g cognitive abilities are related to a third important thing intelligence is useful to get: income. They use about 70000 participants of the PIAAC, an international survey of adults. PIAAC measures three “skills”: literacy, numeracy, and technological problem solving. These, of course, show a positive manifold like any other cognitive test battery. The question is: if we extract the first common factor (g), do the others still matter for income? Among people with otherwise the same level of general cognitive ability, do those with better numeracy or literacy make more money? The main results in one picture:
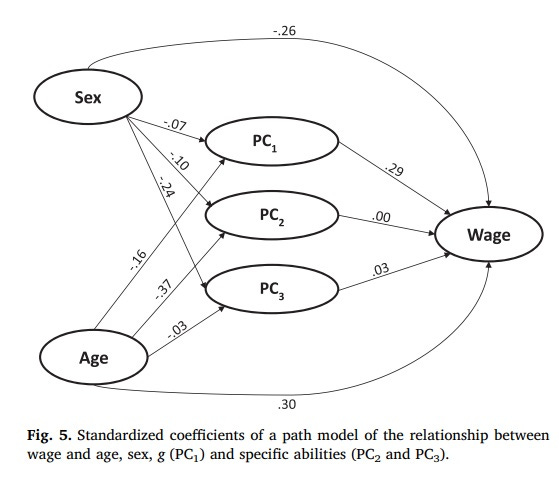
The answer is “no”. As you can see, only the path coefficient from PC1 to Wage is substantial: higher g predicts a higher income. Non-g abilities don’t significantly contribute to income – only general smarts matter.
An interesting feature of this analysis that these results only appear once the authors control for age and sex. Why this is the case is visible on the graph: both demographic variables are related to all of the principal components. Women and younger people make less money, and there are also cognitive correlates of age and sex. Non-g cognitive skills are correlated with income without the proper demographic controls because they are proxies for who is a man and who is older.
If you are looking for an even more direct comparison with personality tests, look at this conference presentation and abstract (as of yet, this is unpublished). The authors here analyze how well you can use non-g information at the item level in psychometric tests to predict education, income (and also sex). After mining out all item-level information with machine learning algorithms, prediction accuracy can be improved by maybe 10-15%, which is not zero but much less than in case of personality tests.
The three examples above show that when we hold the cognitive positive manifold to Revelle’s standards we previously applied to personality and psychiatric disease, extracting the general factor seems to be the right way to handle the data. Once we extract g, just like Jensen thought, we have learned somewhere between everything and almost everything useful from the test to predict job performance, school grades and income: almost as if performance on specific tests or tasks was only useful to the extent it taps into an underlying general ability which is what is truly useful in life.
If you are looking for an even more direct comparison with personality tests, look at this conference presentation and abstract (as of yet, this is unpublished). The authors here analyze how well you can use non-g information at the item level in psychometric tests to predict education, income (and also sex). After mining out all item-level information with machine learning algorithms, prediction accuracy can be improved by maybe 10-15%, which is not zero but much less than in case of personality tests.
Ifs and buts
My point with this essay was to agree with Revelle that discovering a latent variable is not the same as discovering a real psychological construct. Doing the latter requires additional steps, and investigating the importance of common and unique variance is one of them. After doing these additional steps, reducing personality or psychiatric illness to a few easy-to-understand constructs doesn’t seem like a good idea. But reducing intelligence to a single g sure does. This doesn’t just show that you can get an useful aggregate metric by summing up people’s scores on a bunch of cognitive tests. This has implications about the reality of g as a psychological construct. After all, if there really are modular, functionally independent cognitive abilities that correlate almost by accident, as Thomson and Kovács & Conway suggest, then why is their overlap so special? You should use your “short-term memory” or “visual reasoning” or “verbal comprehension” abilities to get ahead in life, and there shouldn’t be anything special about their accidentally existing common variance. But there is, and this is why I think that there really is a general intelligence. This idea originally came from factor analysis, but in this particular case we absolutely should reify the common variance.
But there are ways in which g is still not real.
For once, at a very low level the brain probably is organized around specific, modular abilities. You can see this from the fact that brain injury tends to affect specific skills, not make people overall less intelligent. There is no “g lobe”, and it is understandable if a cognitive psychologist or a neurologist is interested in the brain correlates of lower-level cognitive abilities because he is more likely to find them. g probably arises at some higher level of organization – maybe from a bottleneck that processes information flowing from these modular areas of the brain, which is less narrow in smarter people. Jensen himself suspected g was mostly processing speed, related to axon myelinization. Richard Haier suspected it was the efficiency of neural processing. David Geary recently proposed that it’s mitochondrial functioning. It’s probably not that simple but there certainly is cognition beyond g.
Also, the fact that there is a real general intelligence doesn’t preclude the existence of other abilities. There clearly are people with identical overall IQ scores who have strengths in verbal, mathematical or spatial skills. This is called ability tilt and it predicts career choice. Thorndike & Hagen noticed it way back in the 1950s. They studied WW2-enlisted American who had various cognitive scores from the Air Force and their career was known 12-13 years later. As you would expect, lawyers were smart overall but below average in visual-perceptual skills, while carpenters were not smart but they actually beat the lawyers in this specific domain. Thomas Coyle did a lot of great work in this domain. We also saw some cases where non-g abilities mattered for some school subjects. It’s not that “you are either smart or stupid and everything else is just measurement noise” – but general intelligence is a real thing, not an epiphenomenon or a statistical illusion and it really is the “chief active ingredient” of cognitive tests for most real-life outcomes.
Just saw this and sent it to Bill Revelle, who responded: "Thanks. That is a very nice analysis."